The Linaro Forge tools – which include DDT, MAP, and Performance Reports – are provided for debugging, profiling, and optimizing code. Forge tools can be used with Fortran, C, C++, and Python code, and both CPU and GPU code can be analyzed.
While Forge can be used with both serial and parallel applications, its real strength is in profiling large MPI codes that span many nodes – a task that is very challenging with traditional debugging and profiling tools like gdb and gprof.
To get started, first configure the client interface on your local machine by following the recommended procedures below. This will allow you to begin debugging and profiling jobs.
Page contents
Preparing your code on Derecho
For compiled codes (e.g., Fortran/C/C++), you will need to add debug symbols to the binary to allow DDT and MAP to sample the program during execution. However, you do not need to add these symbols when using Performance Reports.
CPU code: Use the -g option when you compile your code before debugging or profiling.
CUDA code: Include both the -g and -G options for the NVIDIA compilers to debug GPU code.
Do not move or remove the source code, binary, or executable files from the directory or directories in which you compiled them.
Preparing applications that use Cray-MPICH MPI for profiling
A limitation currently exists in Cray's Common Tools Interface which prevents preloading of the MPI sampling library at profiling time. This limitation means that any profiling done on codes that use Cray-MPICH MPI with either MAP or Performance Reports will require manual creation of the sampler library and linking of this library into your application executable. For example, let's suppose you wish to sample a simple MPI model called cfd.exe. Here is how you would need to link the executable:
# First, create the sampler library
module load linaro-forge
make-profiler-libraries --platform=cray --lib-type=shared

# Now, link sampler library into executable
mpicc -L$(PWD) -lmap-sampler-pmpi -lmap-sampler -Wl,--eh-frame-hdr -Wl,-rpath=$(PWD) -o cfd.exe main.o driver.o physics.o
These extra linking steps can be challenging to incorporate into some custom build systems. In this case, you can leverage flags supported by the ncarcompilers wrapper to avoid injecting the necessary flags manually. For example:
# First, create the sampler library
module load linaro-forge ncarcompilers
make-profiler-libraries --platform=cray --lib-type=shared

# While building the application, link the sampler using the NCAR wrapper (bash syntax)
NCAR_LDFLAGS_FORGE=$PWD NCAR_LIBS_FORGE="-lmap-sampler-pmpi -lmap-sampler -Wl,--eh-frame-hdr" ./build.sh
Using DDT or MAP via a Remote Connection
Both DDT and MAP feature complex graphical user interfaces (GUIs) that perform best when run on your local machine. To support this workflow, these tools provide a "remote-connect" option that allows your application to run on the remote system (e.g., Derecho) while the GUI runs on your workstation. (The tools also run from your command line interface).
Client interface setup
The client software version that you use locally and the server version that you use on Derecho must be the same. We recommend using the latest version available. Run module av linaro-forge to identify the latest version.
Procedure
Download the client software from the Linaro site.
Install and start the client on your local machine.
From the "Remote Launch" menu (see image), select Configure.
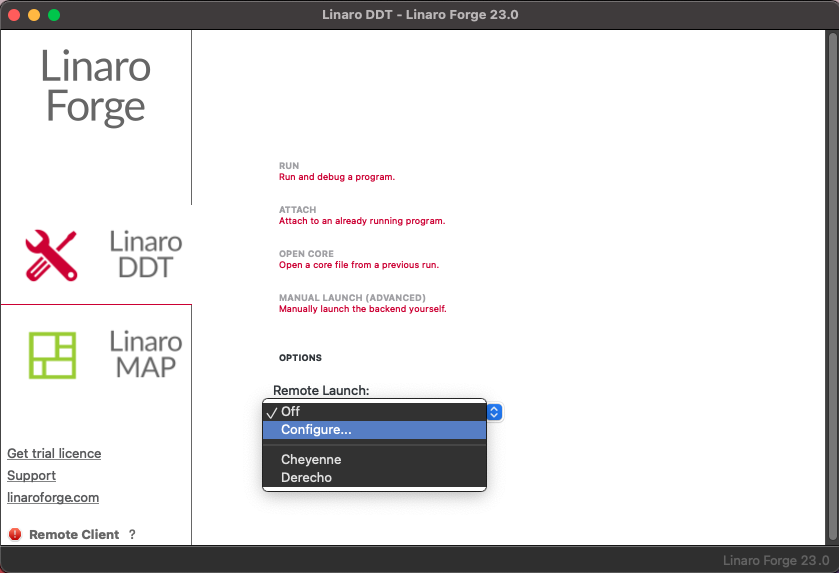
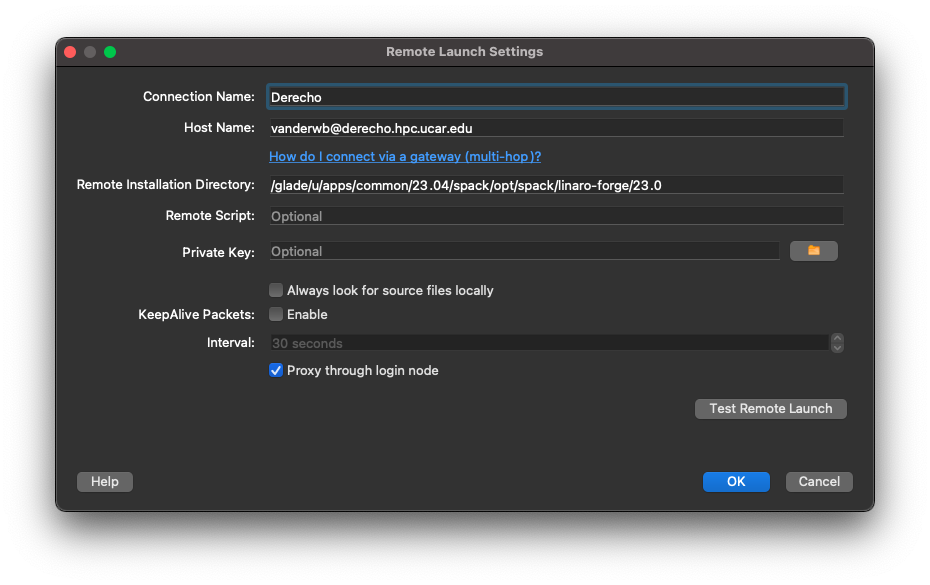
Configure as shown in the following image. The configuration will apply to both DDT and MAP, so you only need to do it once.
Enter your username followed by @ and the connection name (derecho.hpc.ucar.edu, for example) in the “Host Name” field.
Then, fill in the “Remote Installation Directory” field. Once you have loaded the linaro-forge module, you can get the installation directory by echoing the following variable:
echo $NCAR_ROOT_LINARO_FORGE
Click OK.
Running a script
Prepare a job script. Specify the "main" submission queue on Derecho and customize the script with your own project code, job name, and so on.
On the last line of your script, use ddt --connect (or map --connect) instead of mpiexec.
ddt --connect ./my_executable
Submit your job when indicated below.
Procedure
Start the client interface on your local machine.
From the "Remote Launch" menu, select the name of the host configuration you created in the previous step.
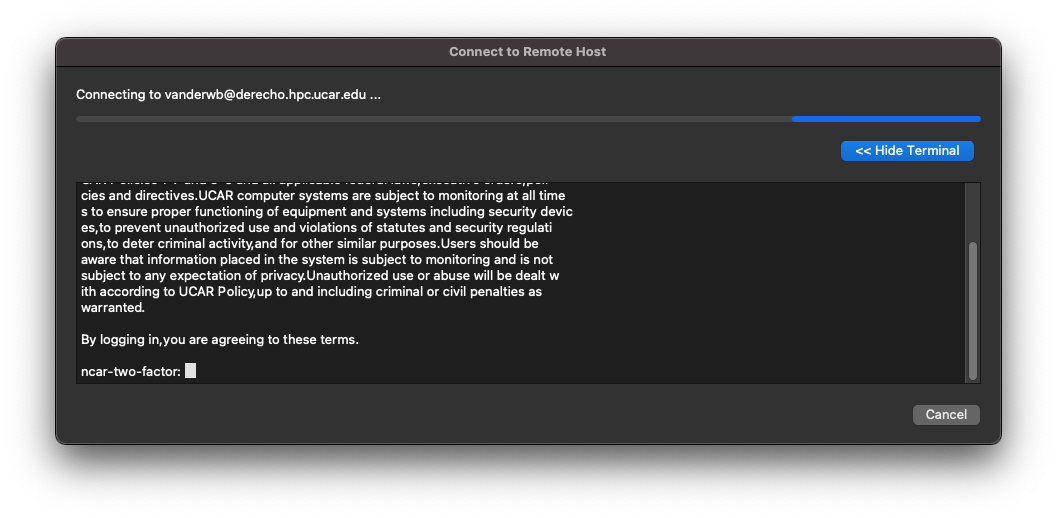
When the following dialog box appears, authenticate as usual. (It may be necessary to click Show Terminal to see the authentication window).
After you log in, return to your normal terminal window and load the modules you need. (We recommend including module load commands in your job scripts).
module load linaro-forge/23.0
To debug GPU jobs, you may need to set the environment variable CUDA_DEBUGGER_SOFTWARE_PREEMPTION to 1.
export CUDA_DEBUGGER_SOFTWARE_PREEMPTION=1
Submit your job script on your command line as in this example:
qsub my-debug-script.bash
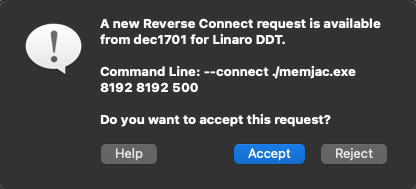
When your job starts, the GUI will show that a “Reverse Connect Request” has been made. Accept the request to continue.
A “Run” window will open and display settings imported from your job script. Review the settings. If your program uses Cray MPICH, make sure the MPI is specified as Cray PALS where shown in the following image.
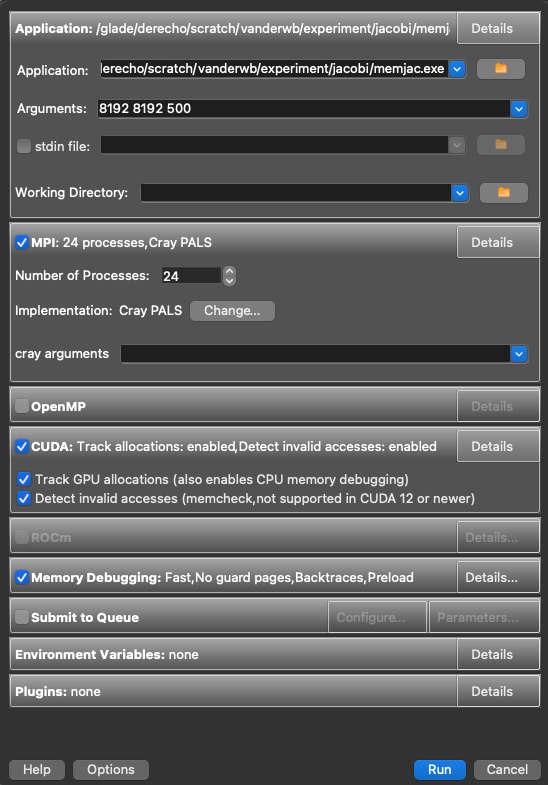
After reviewing the settings, click Run and the DDT or MAP window will open.
Quit when you’re finished so the license is available to other users.
Performance Reports
Performance Reports is another profiling tool provided by Linaro Forge. It summarizes the performance, memory usage, I/O, and more of application runs.
To generate a performance report, submit a batch job which runs your application prepended by the perf-report command (there is no remote connection mode). You do not need to compile your application with the -g debug option first.
Modify your batch script to load the linaro-forge module that you want to use and include perf-report as shown in the sample scripts below.
When your job runs, the output will include both text and HTML report files.
For additional information, see the Linaro Forge product documentation.
Sample bash script
#!/bin/bash
#PBS -N pr-job
#PBS -A project_code
#PBS -l walltime=01:00:00
#PBS -q main
#PBS -j oe
#PBS -l select=2:ncpus=128:mpiprocs=128

module load linaro-forge/23.0

export TMPDIR=$SCRATCH/temp
mkdir -p $TMPDIR

### Run the executable
perf-report --mpi -n 256 ./executable_name.exe